Report on the LDA
Public Consultation Exercise (Nov 2004)- Appendix 1
APPENDIX 1 - Who Attended the Consultation
1. Attendance Statistics
The following table shows the breakdown by age and gender of those who attended. The figures probably represent a slight under-estimate of attendees as it was difficult to register every individual or group at busy times. (Ages were estimated by NWA staff.)
The total of nearly 2,500 constitutes a very good sample indeed, and is well above the size required for accurate sampling of very large populations. (See, for example, "Practical Evaluation Guide", Judy Diamond, Altamira Press, 1999, which quotes a sample size of 1067 for a population of 100,000,000 for a sampling error margin of only 3%.)
Within the sample, most age groups were well represented. One clear exception however, is the youth age group; not only were youth attendee numbers very low, but it is also possible that the response rate from those who did attend was lower than for the adult groups. Young adults may also have been under-represented, but this is based on general impressions only and separate statistics were not kept for this group.
Attendees appeared to comprise a broad spectrum, and reasonable balance, of ethnic groups, but this again is based on general impressions.
2. Origin of Households
Attendees were asked to place a dot on either a local or London-wide map to indicate where they lived. These are shown as figures 1 & 2 below and indicate that the great majority (c. 75%?) of households who attended live within about 1.5 miles of the park, particularly to the south, east and west. Fewer lived to the north, although even there, most streets very close to the park had some representation. However, Kingswood and Central Hill estates do not appear to have been represented at all (but Sydenham Hill estate was).
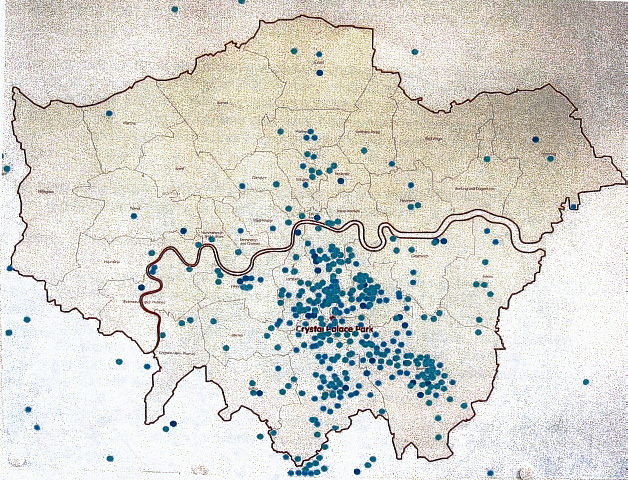
Of the remaining attendees, the great majority were from the five boroughs adjoining the park, with only a handful (probably less than 2%) from elsewhere in London or further afield.
(Note that the intention was also that those who lived locally would place their dots on the large scale map, while those from further afield would use the London-wide map, but in some cases the London map was also used by local residents.)
Figure 1: Origin of Respondents Living Near the Park
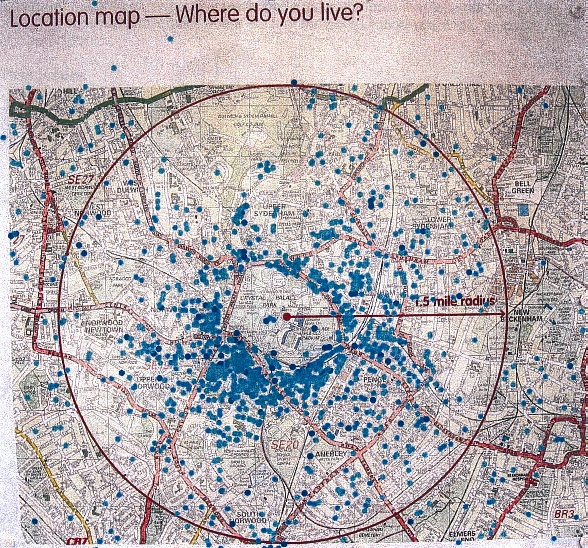
Figure 2: Origin of Respondents from Elsewhere in London
3. Numbers and Types of Response
The great majority of responses were made using the post-it notes supplied. The following shows the numbers under each of the consultation headings, as posted by the participants.
Park Issues
Status Quo 191 Basic Tidy up 193 Moderate
improvements 316 Extensive
improvements 516
Sports Issues
NSC 215 Sports mix 241 Sports studies 504 What happens
next? 239
Other Ideas
Graffiti board 282
Total Post-it Responses
2,697 (totalling 5,760
separate comments)
In addition to the post-its, a further 13 responses were received on typed or hand-written sheets and 106 were made via the website.
Introductory
letter(LDA);
Summary
of Key Findings;
Contents;;
Section
A; Section
B & C; Meetings
Index
![]()
3/12/2004 Last updated: 3/12/2004